Productivity report
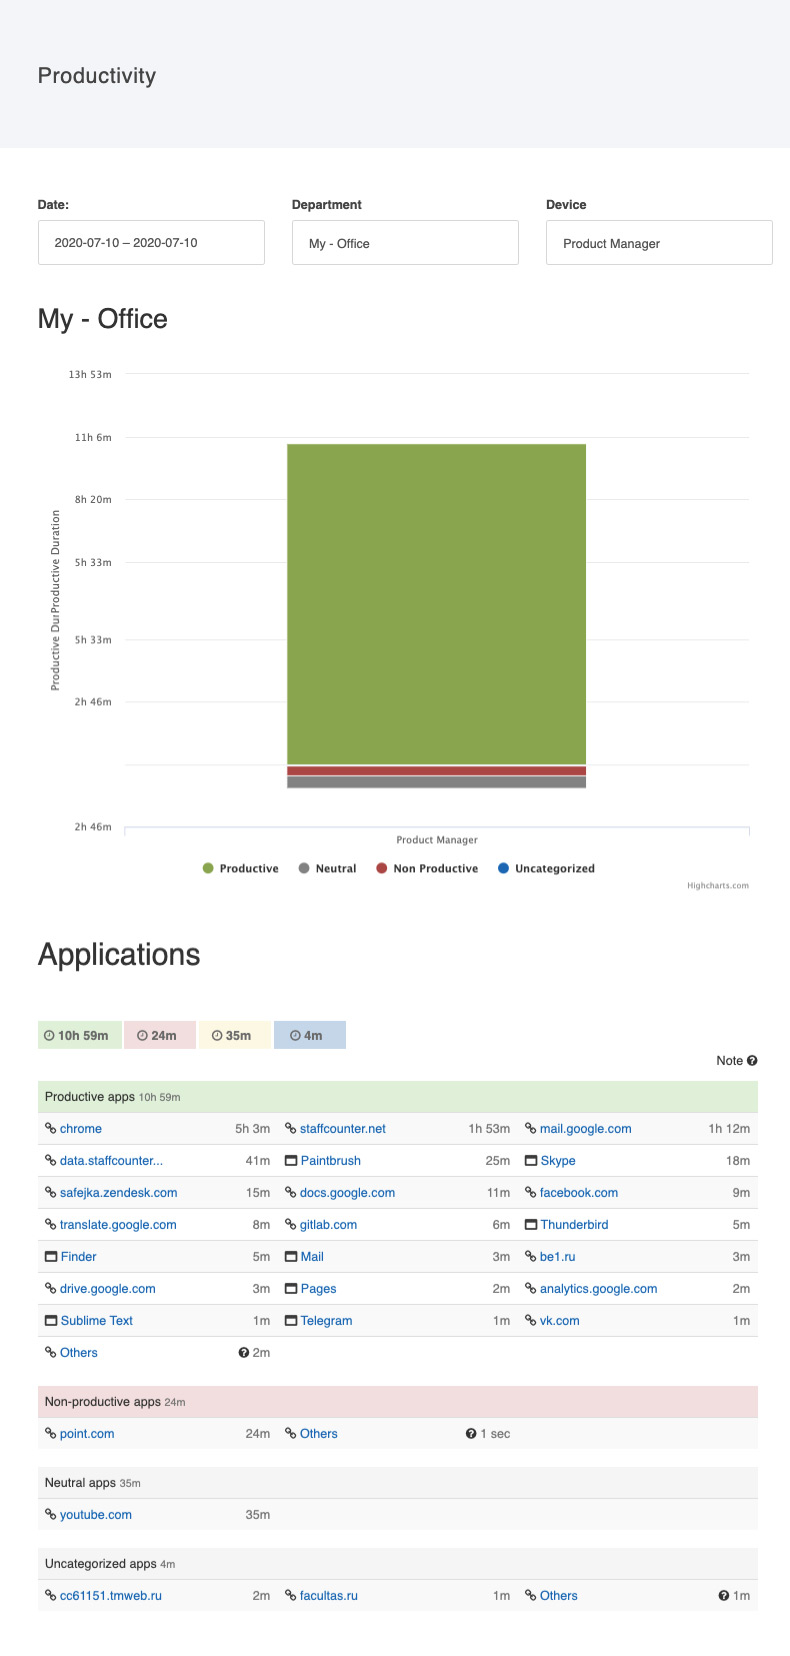
The productivity report shows how each employee spends their working time.
It displays which applications and websites were used and how much of the recorded time is classified as productive, neutral, unproductive, or uncategorized.
Using the filter, you can set the start and end dates of the reporting period, as well as select data for a specific department or employee.
Most often, managers review data for a week or a month.
The report is divided into two sections:
– Bar graphs showing productive, neutral, unproductive, and uncategorized time;
– A table of applications and websites used by the employee during the selected period.
The table is grouped into categories:
– Productive applications
– Neutral applications
– Unproductive applications
– Uncategorized applications
Each application entry includes its name and the total amount of time the employee spent using it during the specified period.
