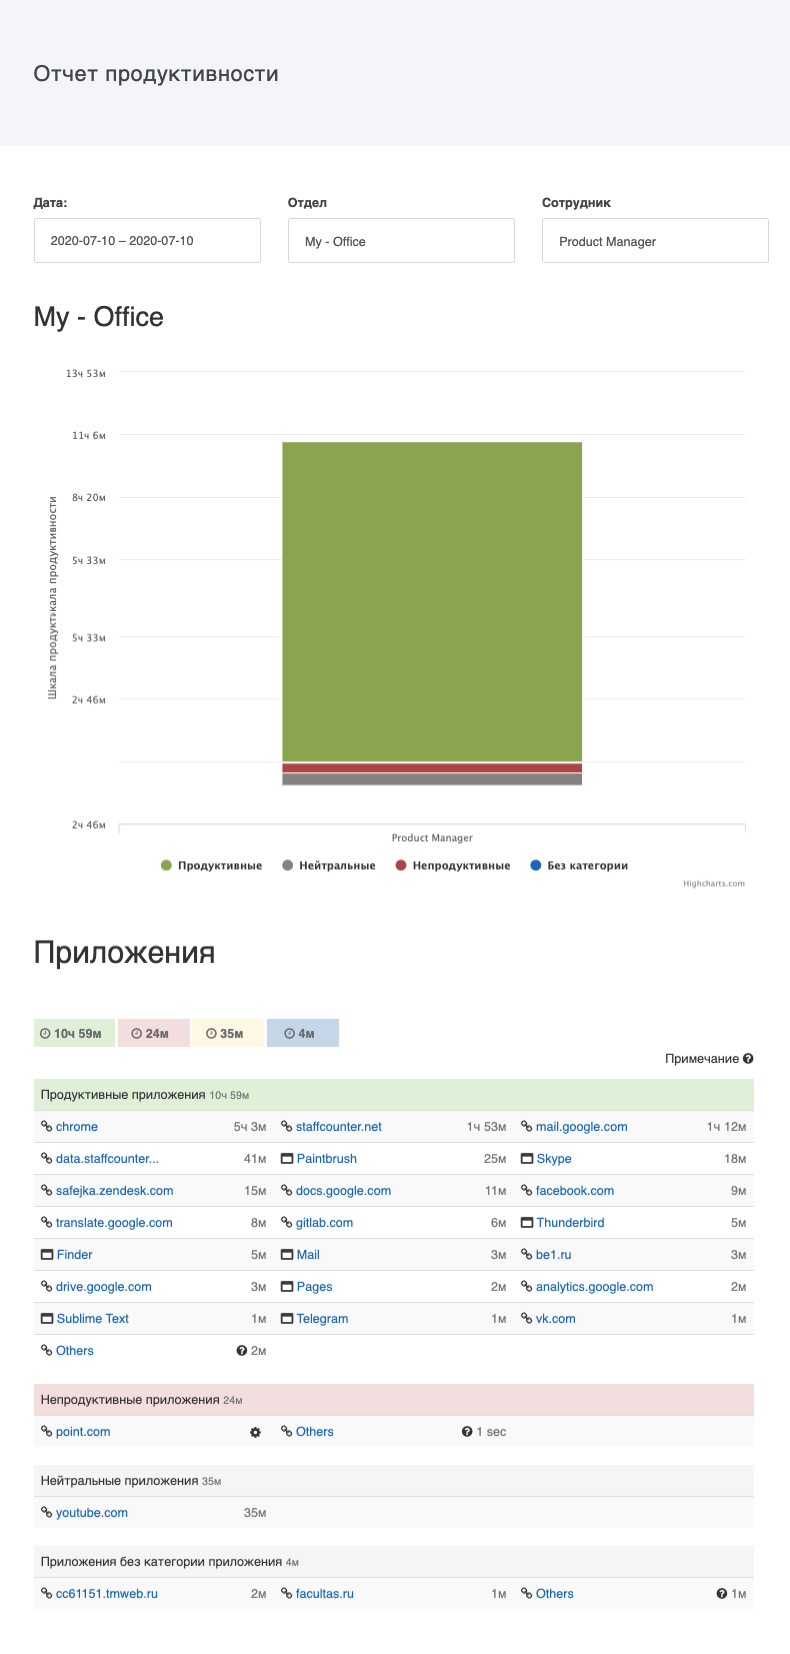
Отчет продуктивности
Отчет по производительности показывает на что каждый сотрудник потратил свое рабочее время.
Какие приложения и сайты он использовал в своей работе, а также сколько из его рабочего времени можно считать продуктивным, нейтральным, непродуктивным или без указанной категории.
С помощью фильтра можно установить дату начала и дату конца просматриваемого периода, а также выбрать данные по определенному отделу или сотруднику.
Чаще всего руководители используют данные за неделю или за месяц.
Отчет представлен двумя блоками:
– Столбчатая диаграмма с разбиением на продуктивное, нейтральное, непродуктивное время или время без указанной категории;
– Таблица приложений и сайтов, в которых работал сотрудник за выбранный период.
Таблица разбита на категории:
– продуктивные приложения,
– нейтральные приложения,
– непродуктивные приложения,
– приложения без указанной категории.
Каждое приложение имеет название и показывает сколько времени провел сотрудник, работая в нем, за указанный промежуток времени.
