Суммарный отчет продуктивности и использование приложений
Суммарный отчет продуктивности и использование приложений разбит на следующие виды отчетов:
– РАБОЧИЕ ЧАСЫ;
– ПРОДУКТИВНОСТЬ СОТРУДНИКОВ;
– ОПОЗДАНИЯ И СВЕРХУРОЧНЫЕ;
– ТОП 10 ПРИЛОЖЕНИЙ;
– ИТОГИ ПО КАТЕГОРИЯМ.
С помощью фильтра можно установить дату начала и дату конца просматриваемого периода, а также выбрать данные по определенному отделу.
Чаще всего руководители используют данные за неделю или за месяц.
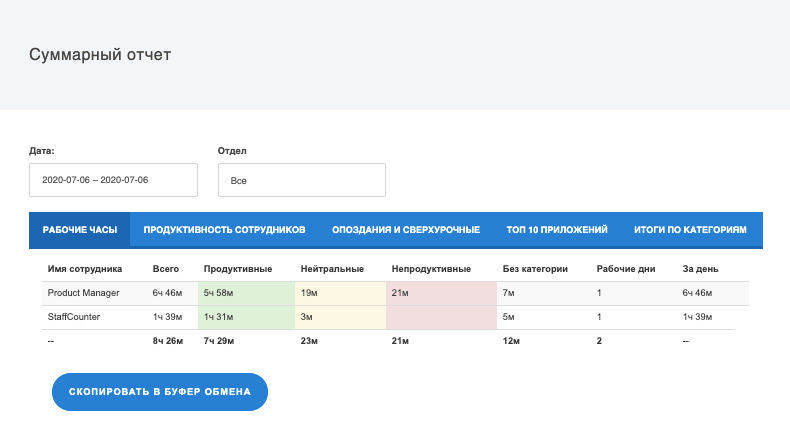
РАБОЧИЕ ЧАСЫ
В данном отчете указано:
– Сколько всего каждый сотрудник отработал за указаны период;
– Количество продуктивных часов;
– Количество нейтральных часов;
– Количество непродуктивных часов;
– Часов без категории;
– Сколько в этот период было рабочих дней;
– Сколько в среднем сотрудник отработал в каждый рабочий день.
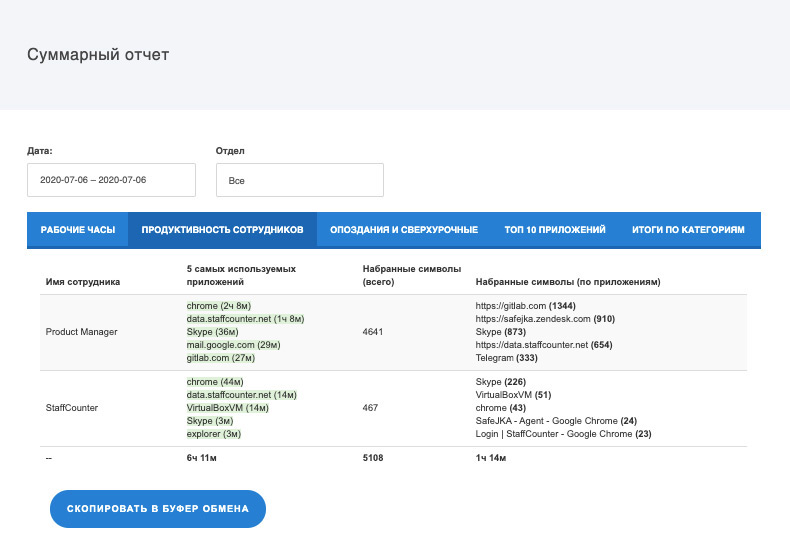
ПРОДУКТИВНОСТЬ СОТРУДНИКОВ
В данном отчете указано:
– 5 самых используемых приложений сотрудниками и общее время проведенное в каждом из них;
– Количество набранных символов;
– Наибольшее количество набранных символов по приложениям.
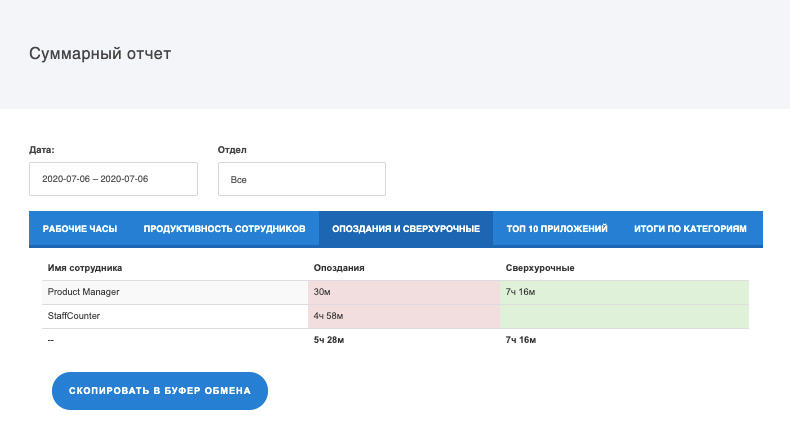
ОПОЗДАНИЯ И СВЕРХУРОЧНЫЕ
В данном отчете указано:
– Общее время опоздания по каждому сотруднику за указанный период;
– Общее время сверхурочных по каждому сотруднику за указанный период.
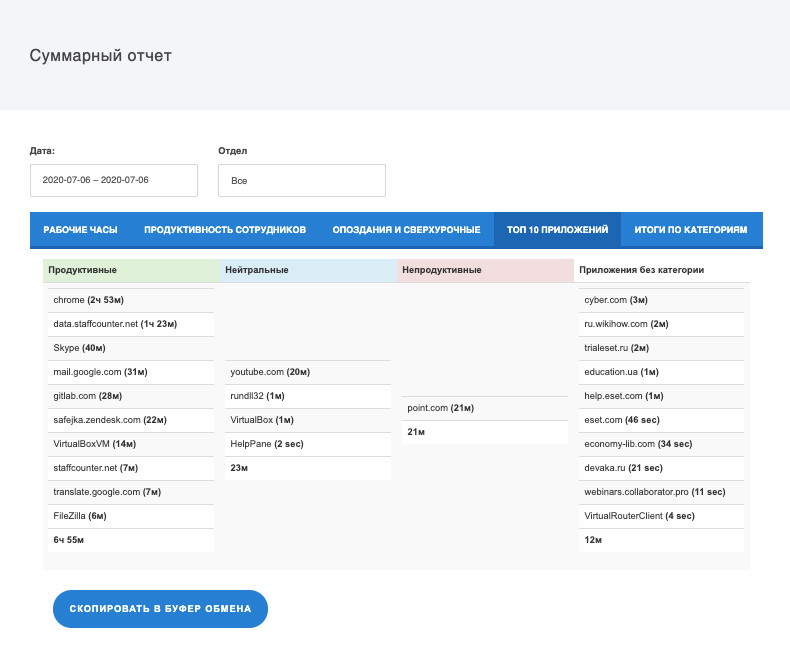
ТОП 10 ПРИЛОЖЕНИЙ
В данном отчете указано:
– Топ 10 приложений в каждой категории (продуктивные, нейтральные, непродуктивные и без категории);
– Время проведенное в каждом приложении.
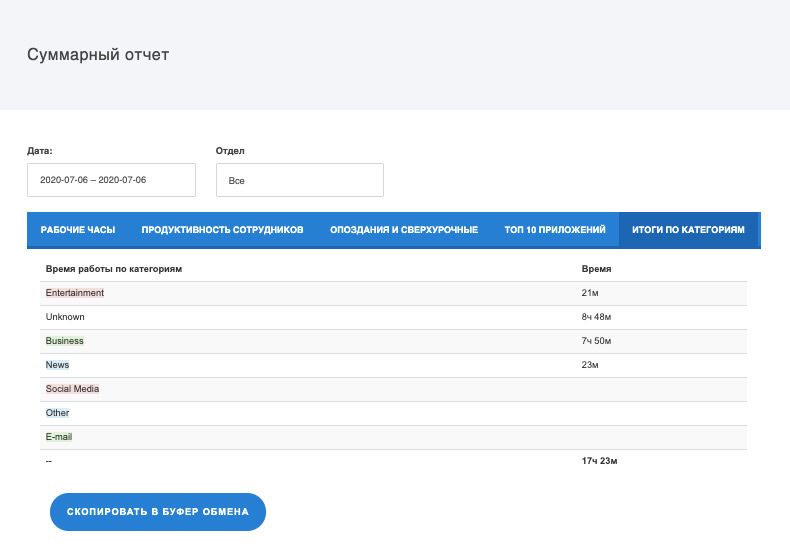
ИТОГИ ПО КАТЕГОРИЯМ
В данном отчете указано время работы сотрудника в приложениях разбитое по категориям:
– Entertainment;
– Unknown;
– Business;
– News;
– Social Media;
– Other;
– E-mail.